10 minutes
Benchmarking C# in Unity Without Lying to Yourself

Benchmarking code in Unity is not about finding one fps number and declaring victory.
The real goal is narrower and more useful: did this change make the game faster, slower, or merely different? That question is easy to ask and surprisingly hard to answer honestly because game performance work mixes several separate activities and treats them as if they were one thing.
Profiling a live scene. Timing a small code path. Comparing two builds over time. Tracking regressions across a branch. Those jobs are related, but they are not interchangeable.
A benchmark only becomes useful when the question is precise and the test conditions are stable.
Start with the question, not the tool
The fastest way to get a bad benchmark is to start by opening a timer and hope the numbers explain themselves.
The better order is to decide what problem is actually being solved.
If a scene stutters, the Unity Profiler is the first stop. If two versions of a function need comparing, a benchmark is the right tool. If regressions need tracking over time, the benchmark should rerun in the same conditions again and again.
Unity’s own profiling guidance makes this point directly: profile before and after a change, use frame time instead of fps, and measure on the target device when the numbers matter. That advice sounds obvious, but it is the part people tend to skip when they are trying to move fast. Then the wrong thing gets optimized and the hitch remains.
Frame time beats fps
Fps is fine for a headline. Frame time is what the player actually feels.
A game can report a comfortable average fps and still hitch badly if one frame blows the budget. That is why the useful questions are usually:
- how long does the average frame take?
- what do the worst frames look like?
- does the change shift the distribution or just the average?
For a 60 fps target, the budget is about 16.6 ms per frame. That sounds like a lot until rendering, physics, animation, UI, scripting, and asset work all start competing for the same slice of time.
Average fps alone can hide spikes. A benchmark that ignores spikes is often lying by omission.
Profiling, microbenchmarking, and regression tracking are different jobs
A profiler and a benchmark answer different questions.
A profiler shows where time went inside a real scene. A microbenchmark shows whether a tiny piece of code changed in a useful way. A regression test shows whether a known behavior stayed within a target range across builds.
Those are not the same because the context changes. The profiler includes engine overhead, scene setup, unrelated systems, asset work, and sometimes editor noise. That is valuable context when hunting a bottleneck. It is also why profiler numbers should not be treated as a perfect replacement for a focused benchmark when comparing two algorithms.
A benchmark should be boring:
- same input
- same scene or fixture
- same build configuration
- same hardware
- same warmup pattern
- same number of repeated runs
If those change, the test stops being a benchmark and turns into a story.
Warm up first
The first run is often weird.
In the Editor, managed code may pay JIT or initialization costs. In a player build, the first run can still include lazy initialization, cache misses, asset loading, or one-time setup. The first sample is usually not the sample that should be trusted.
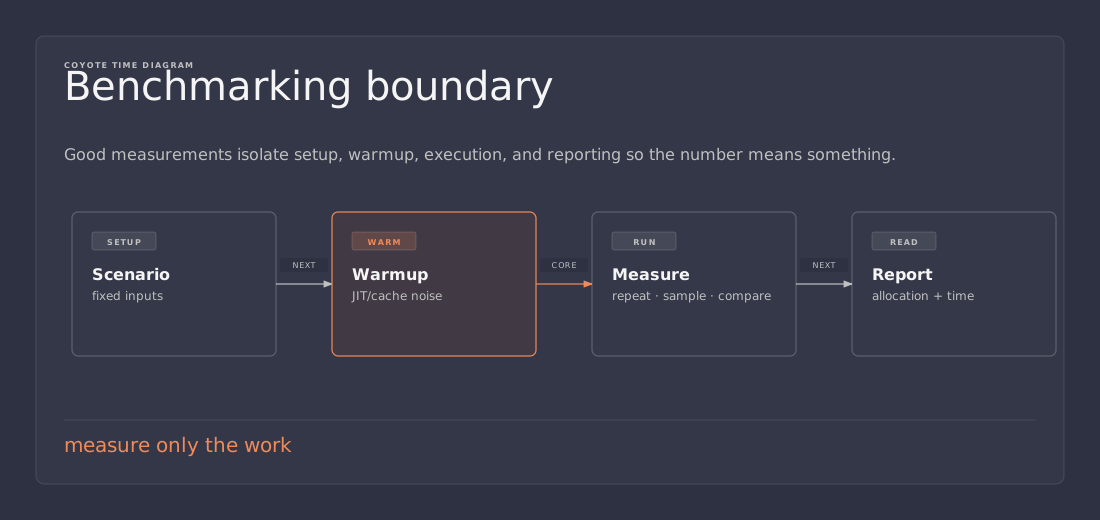
A simple benchmark usually does three things:
- warm up the code
- discard the first run
- measure several later runs and compare the median or average
That is not glamorous. It just avoids the most obvious lie.
If a benchmark gets dramatically better or worse after the first sample, that is a sign the setup is still too noisy.
Use the right timing tool
For small C# timings, Stopwatch is the standard tool.
It exists for elapsed-time measurement, and the .NET docs make that explicit. That makes it far more appropriate than trying to infer microseconds from frame counters or from Time.time.
A tiny local benchmark can look like this:
using System;
using System.Diagnostics;

static double Benchmark(Action action, int iterations)
{
    var sw = Stopwatch.StartNew();

    for (int i = 0; i < iterations; i++)
        action();

    sw.Stop();
    return sw.Elapsed.TotalMilliseconds;
}
That function only tells the truth if the work inside action is stable. If the action allocates, touches random data, depends on scene state, or mixes in unrelated work, the result is mostly noise.
So Stopwatch is useful for timing a specific code path, not for replacing a performance strategy.
Allocations matter as much as time
In Unity, a faster path is not automatically a better path.
A change can shave time off a loop and still make the game worse if it starts allocating every frame. The Unity manual on GC tracking is blunt about this: GC.Alloc reports managed heap allocations, and editor measurements can be misleading. Accurate results come from profiling a development build on the target platform.
That means every benchmark should watch for two separate failure modes:
- the code got slower
- the code got cheaper to run but started allocating more often
The second one is sneakier because it often survives simple local checks. A function can look excellent in a microbenchmark and still cause garbage collection pain in a real scene.
If runtime counters are needed, ProfilerRecorder is useful because it can read profiler metrics from editor or player builds. The API is explicitly meant for this sort of observation. It still needs clean test conditions and careful disposal, though. A counter is only as useful as the test around it.
Editor numbers are a clue, not the answer
The Editor is convenient. It is not the same as a player build.
Unity’s profiling guidance says this plainly: Play mode profiling is useful for quick checks, but target-platform profiling is where the most trustworthy numbers live. That is not an academic distinction. The Editor adds enough overhead that it can hide or invent problems.
When the result matters, the checklist usually looks like this:
- build a Development Build
- run on the target device or platform
- keep the scene and inputs fixed
- warm up once
- measure several times
- compare against the baseline
If a regression matters, do not trust a one-off Editor run. The Editor can tell a story, but the player build tells the truth.
A practical benchmark workflow
A useful benchmark workflow is small and repeatable.
1. Measure the baseline
Record the current behavior before changing anything. A benchmark without a baseline is just a number.
2. Warm up the code
Throw away the first run so startup noise does not contaminate the result.
3. Measure the same thing many times
Single samples are too easy to distort.
4. Watch allocations and frame time
A faster result is not better if GC pressure gets worse or frame spikes become more frequent.
5. Run on the target build
Editor timings are only a hint.
6. Change one thing at a time
If five things change, the data stops explaining which change mattered.
That last step is where a lot of performance work goes wrong. People compare two versions that differ in half a dozen ways and then wonder why the result is muddy.
What not to benchmark
Some things are bad benchmark candidates from the start.
Avoid benchmarking code that is:
- one-off setup that runs only at load
- heavily dependent on random gameplay state
- tied too closely to the rest of the scene
- dominated by editor overhead instead of the code being measured
Sometimes the right answer is not “write a benchmark.” Sometimes the right answer is “profile the real scene in a real build and stop pretending a microbenchmark will solve the problem.”
That is not a failure. That is choosing the right tool.
A benchmark is best when the code path is stable and isolated. A profiler is best when the code path is tangled with the rest of the game.
Why small changes can produce noisy results
Performance work gets messy because game code rarely lives alone.
A “simple” function may be affected by JIT warmup, collection pressure, scene layout, cache state, animation timing, or the order in which previous systems ran. In Unity, even a tiny code path can be influenced by surrounding engine behavior.
That is why benchmark results should be interpreted as ranges, not magical truth pills.
If a change improves a function by 2 percent in one run and hurts it by 1 percent in another, the result may simply be noise. The benchmark needs either more runs, a better fixture, or a larger signal. A small result can still matter, but only if the test is clean enough to trust.
A code path benchmark can stay simple
A benchmark harness does not need to be fancy.
For many C# cases, a timer loop around a pure function is enough. What matters is the setup around it.
- initialize once
- use fixed data
- separate warmup from measurement
- repeat several times
- record the median if outliers are common
That is usually enough to answer whether a change is worthwhile.
If the code depends on the scene, the benchmark fixture should look like the scene. If the code is pure computation, keep it pure. The more the benchmark resembles the real use case, the more useful the number becomes.
The practical split that keeps teams sane
A useful performance workflow usually breaks into three tools:
- Stopwatch for quick local timing
- Profiler for scene-level diagnosis
- Performance tests for repeatable comparisons over time
That split keeps the team from asking one tool to do all three jobs.
The profiler is the camera. The benchmark is the stopwatch. The performance test is the regression guard.
When to use Unity performance testing
If a repeatable benchmark needs to run as part of an automated test flow, Unity’s performance testing package is the right fit.
That is especially useful when comparing implementations and wanting the result to survive beyond a single laptop. The package is designed to collect metrics and compare results, which is exactly what regression tracking needs.
It is not necessary for every experiment. For a quick local check, Stopwatch is enough. For a benchmark that needs to be rerun tomorrow, a harness is better.
A useful checklist before trusting a result
Before a benchmark result gets treated as real, check the following:
- was the code warmed up?
- was the first run discarded?
- did the test use fixed input?
- was the build a Development Build?
- was the test run on the target platform?
- were allocations measured as well as time?
- were the two versions changed in only one meaningful way?
If any of those answers is no, the result should be treated as provisional.
A good benchmark does not need drama
The best benchmark is usually boring.
It uses the same inputs every time. It measures the same code path every time. It reports numbers that can be compared later. It does not try to prove too much. It just tells the truth about a narrow question.
That is the goal: a benchmark that helps decisions instead of producing confidence theater.
Practical takeaway
For honest performance numbers in Unity, keep three rules nearby:
- profile the scene when bottlenecks matter
- benchmark small code paths when comparisons matter
- measure in a Development Build on the target platform when truth matters
That keeps the project from chasing fake wins and helps catch real regressions before they ship.
References
- Unity Blog, Performance benchmarking in Unity: How to get started
- Unity Manual, Best practices for profiling game performance
- Unity Manual, Profiling your application
- Unity Manual, Tracking garbage collection allocations
- Unity Scripting API, ProfilerRecorder
- Microsoft Learn,
StopwatchClass - Unity Performance Testing Package, Package documentation